ggplot--python version of ggplot2
This is the official website of ggplot (http://ggplot.yhathq.com/), which is very similar to ggplot2 in R. Unfortunately, it seems that it has not been updated since 2016.
Simple example:
import pandas as pd
from ggplot import *
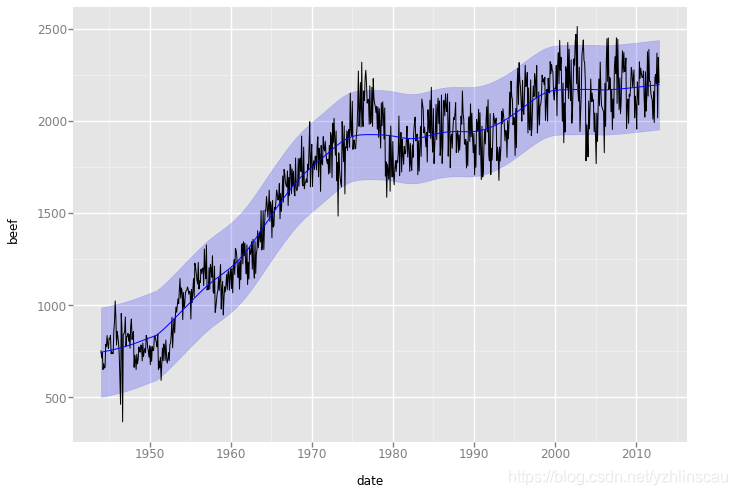
ggplot(aes(x='date', y='beef'), data=meat) +\
geom_line() +\
scale_x_date(labels = date_format("%Y"))+\
stat_smooth(color='blue', span=0.2,method='loess')The generated graph is as follows:
Simple Example 2:
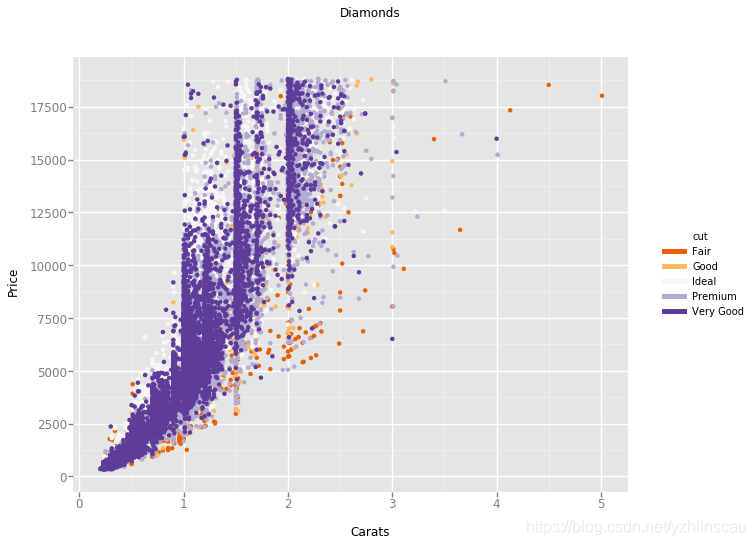
ggplot(diamonds, aes(x='carat', y='price', color='cut')) +\
    geom_point() +\
    scale_color_brewer(type='diverging', palette=4) +\
    xlab("Carats") + ylab("Price") + ggtitle("Diamonds")
The resulting graph is as follows:
The installation method of ggplot in python:
$ pip install -U ggplot
# or
$ conda install -c conda-forge ggplot
# or
pip install git+https://github.com/yhat/ggplot.git
However, there will be some ggplot during use, the reason should be that ggplot has not been updated, and many other python packages have been upgraded.
Problem 1:
AttributeError: module 'pandas' has no attribute 'tslib'
Workaround:
#1. Change `pandas.tslib.Timestamp` to `pandas.Timestamp` (in utils.py and stats/smoothers.py)
#2. Change `from pandas.lib import Timestamp` to `from pandas import Timestamp`. (in smoothers.py)
Problem 2:
AttributeError: 'DataFrame' object has no attribute 'sort'
Workaround:
#Change `smoothed_data.sort('x')` to `smoothed_data.sort_values('x')` (in stat_smooth.py)
