Chip data analysis----chip data visualization
Gene chip technology, also known as nucleic acid array chip technology, was produced in the 1990s and has been scaled and industrialized in the past ten years. It has become an important supporting technology for transcriptome. Gene chip technology can measure the transcriptional expression of thousands of genes under a certain condition. Therefore, there will be a large amount of data and data analysis requirements. The basic process of chip data analysis: image processing of the high-density hybridization spot array on the chip. The fluorescence intensity of the hybridized spots was extracted for quantitative analysis. Extract genes with significantly different expression and co-expressed genes through efficient gene search and clustering of related gene expression profiles;
pd=gprread('mouse_h3pd.gpr')
figure
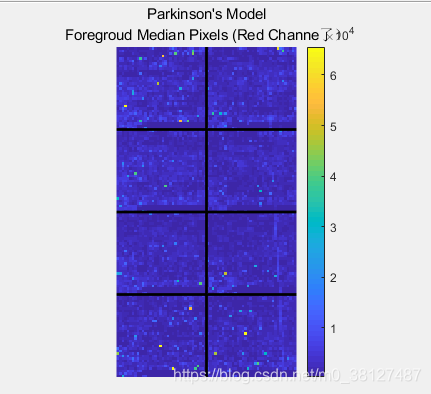
maimage(pd,'F635 Median','title',{ 'Parkinson''s Model','Foregroud Median Pixels (Red Channe)'})
figure
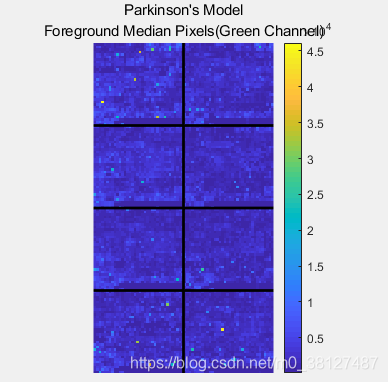
maimage(pd,'F532 meDiAN','title',{'Parkinson''s Model','Foreground Median Pixels(Green Channel )'})
facebook
pd =
A struct with the following fields:
     Header: [1×1 struct]
       Data: [9504×38 double]
     Blocks: [9504×1 double]
    Columns: [9504×1 double]
       Rows: [9504×1 double]
      Names: {9504×1 cell}
        IDs: {9504×1 cell}
ColumnNames: {38×1 cell}
    Indices: [132×72 double]
      Shape: [1×1 struct]
Bioinformatics Analysis and Practice——Application of MATLAB Bioinformatics Toolbox——Edited by Liu Wei, Sun Zhiqiang, Yang Sen——[M] Beijing: China Industry Press and Electronic Industry Press